
Shift is an eComm platform that makes buying and selling cars feel easy and trustworthy. But it didn’t start out that way.
Despite the “stress-free, fully online” positioning, customers found it just as bad as an old-school dealership.
Operations relied too heavily on sales advisors using inefficient processes and questionable dealership tactics. The few online portions were hastily executed. This led to an overall hostile experience that converted low and canceled high.
OBJECTIVES
• Transform checkout into a delightful and trustworthy experience
• Expand gross profit per unit via new operational efficiencies (OKR #1)
• Increase financing rates and protection plan sales (OKR #2)
• Align to UX best practices, industry trends and consumer expectations
APPROACH
Over several major releases and iterations, my team and I transformed the process into a profitable, best-in-class customer experience – starting with the core checkout flow.
IMPACT AND OUTCOMES:
Project Scope
Here, we’ll cover five of six main tentpoles that were critical for making Shift’s car-buying experience a breeze:
1. Reserve Page
2. Main Buyer Dashboard
3. Onboarding/Level-Setting
4. Protection Plans Task
5. Order Tracking
The sixth tentpole is the Shopping Funnel, which I cover in a separate case study here.
Reserve Page
Shift was asking too much, too early with a $250 deposit just to begin checking out.
The original goal was to filter out bad leads, but it filtered out good ones too. CX data also revealed that customers feared their car getting sold to a “faster” customer while they were still completing their purchase.
We solved both problems by eliminating the deposit and reframing the page as a reservation. That way, customers had assurance that the car wouldn’t be sold out from under their feet.
Old page:
PROBLEM
• $250 deposit just to start
• Lack of information
• Pushy tone of voice
• Low transparency
• User-hostile design
HOW DID WE KNOW?
• Sales and customer support
• User testing feedback
New page:
IMPACT
• Significant jump in high-intent purchase initiations
• Decimation of bounce rate
HOW DID WE MEASURE IT?
• Analytics
• Customer feedback via Sales
Dashboard
This is where the bulk of the purchase happens. My team and I worked to align every detail to best practices, establish a clear hierarchy, and set better user expectations through clear content and progress indicators.
Old page:
PROBLEM
• Lack of instruction, task priority, or purpose
• No indication of timing or progress
• User-hostile language, tone
HOW DID WE KNOW?
• Analytics, heat maps
• User interviews, surveys
• CX emails, call logs, chatbot transcripts
New page:
IMPACT
• 44% increase in completion rates
• Significant improvements in user perception, confidence, and trust in the quality of the experience
HOW DID WE MEASURE IT?
• Site analytics
• Unmoderated user studies
• Reduction in distressed support calls, emails
• Post-purchase surveys
Post-purchase testing results:
Onboarding and Purchase Timer
The end must always feel within reach. My onboarding screens gave users all the level-setting clarity needed to make the process feel fast and easy.
Testing showed that customers were still unsure about what to expect and began to lose steam before finishing their tasks. This exploded purchase times and forced sales advisors to intervene. We solved the problem by adding onboarding screens and a 1-hour purchase timer.
New screens and timer:
IMPACT
• Completion rate increase from 44% to 84%
• 12% drop in low-intent users
HOW DID WE MEASURE IT?
• Usability testing
• Site analytics
• Post-purchase surveys
User testing results:
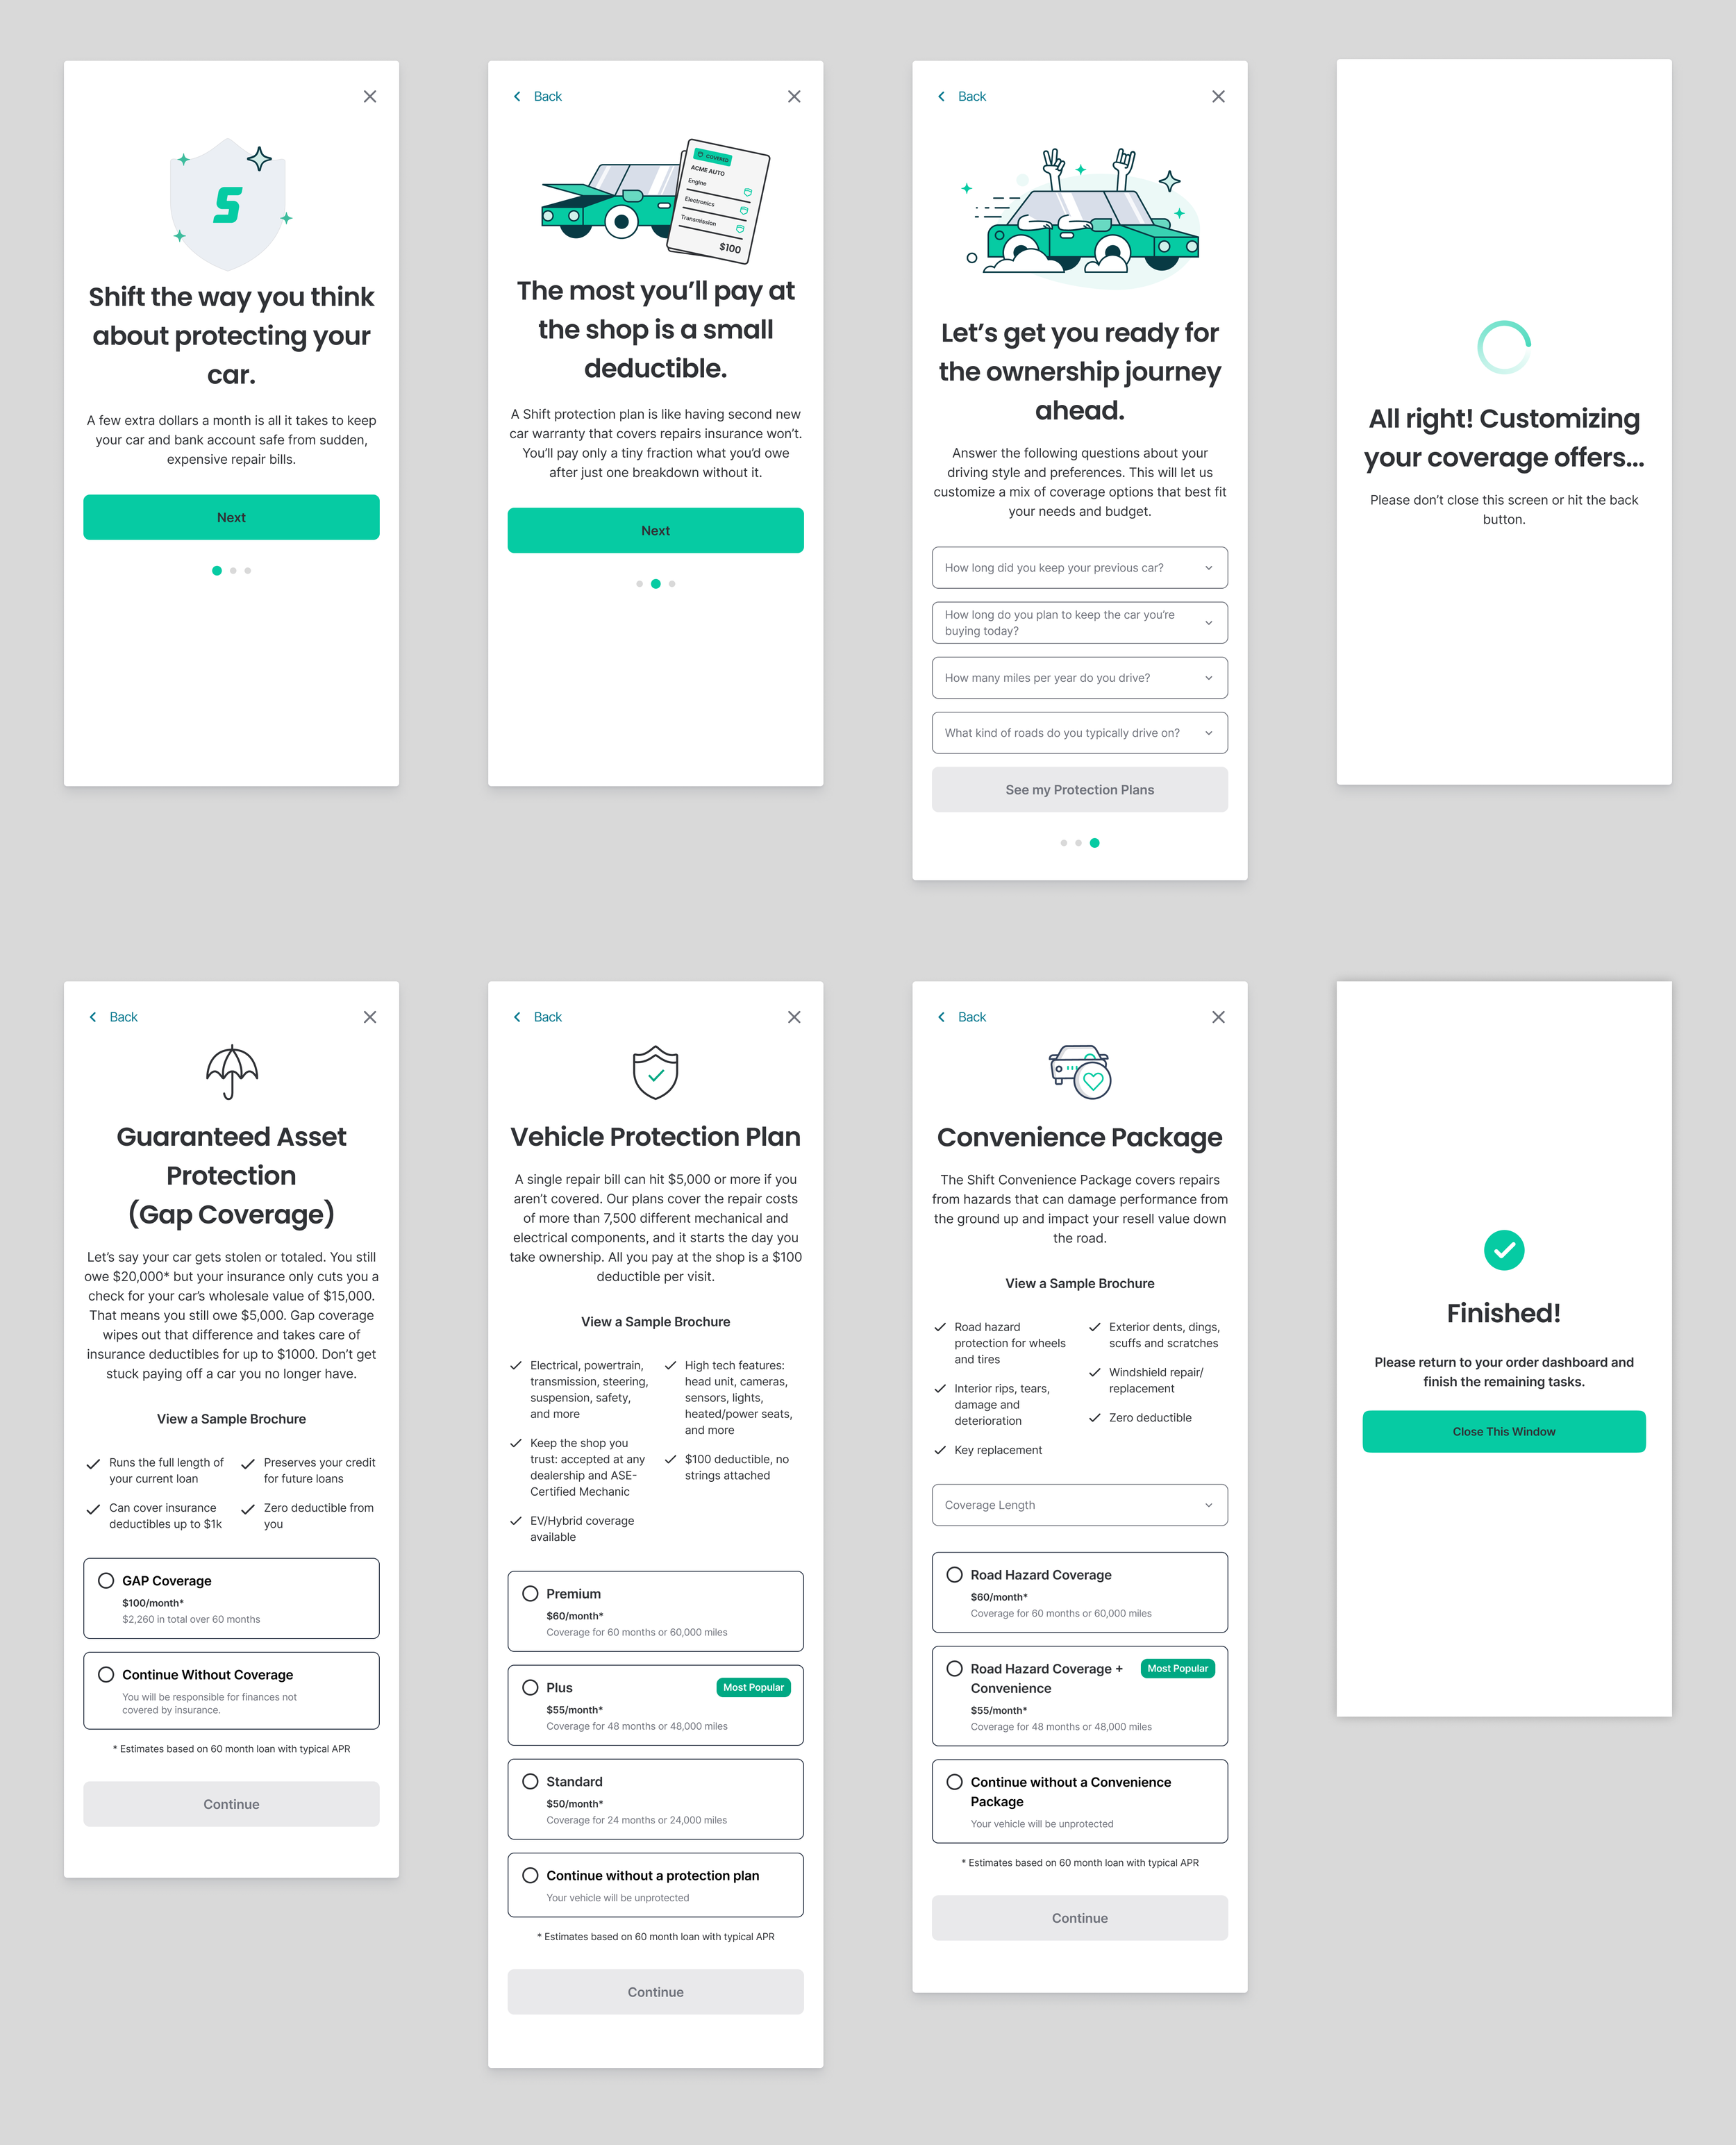
Protection Plans Task
Protection plans comprised half of Shift’s revenue, and getting users to add them during checkout was the key to reversing a -5% QoQ decline.
My new Protection Plans task educated users, dispelled several commonly held myths, and increased sales all in one. Here’s how:
• Added onboarding screens to set the scene
• Introduced a brief questionnaire about the user’s driving habits
• Used the results to personalize their plan offerings
• Provided greater transparency in the right tone and level of detail
• Built an even more nuanced of this into the financing application
Old task:
New task:
IMPACT
Combined efforts across teams increased gross profit 43% YoY for two years and boosted F&I sales by 200%
HOW DID WE MEASURE IT?
• Increased self-attach rates
• Higher advisor-attach rates
• Customer feedback via Sales
• Usability testing
• Site analytics
Order Tracking
The old dashboard offered no ability to track your purchase. This led to a high volume of “dude, where’s my car?” customer support calls. Our new order tracking view showed where the car was at every stage.
I partnered with the Fulfillment team to develop status labels and descriptions that were meaningful to customers, consistent with internal fulfillment statuses, and aligned with UX best practices (Baymard, NN).
Net new order tracker:
IMPACT
• Significant reduction in customer support phone calls and emails
HOW DID WE MEASURE IT?
• Customer support data
• User testing studies
• Post-purchase surveys
User testing results:
Outcome
Seeing our collective efforts come to life was exhilarating, and I’m proud of the many initiatives I led that helped reach this monumental achievement.